v4.0 [Feb 1, 2011]
1.Standard Profiling:
--Silverlight application.
2.Production Code Profiling:
--Use the "attach to" API provided by .NET runtime 4.0 to collect snapshots faster and more securely.
--Use the NmpCore tool to collect memory snapshots on machines where .NET Memory Profiler is not installed.
3.Profiling Levels
--The new profiling levels allow you to select the amount of information to collect from the profiled application. The Medium profiling provides a good balance between the amount of data collected and the performance impact of the profiler. When profiling a very complex and memory consuming application, the Low or Very low level might be more appropriate, as the memory and performance overhead is much lower. To get full memory information, including heap utilization, use the High level.
4.Guided Profiling:
--The profiler guides provide interactive step-by-step instructions that will help you with common memory profiling tasks, such as memory leak investigations.
5.Instance and Allocation Filters:
--Using filters you can get information about instances and allocations that share a common characteristic, e.g. all allocations and instances that are derived from a specific type, all instances that are directly referenced by a root, or all allocations performed by a specific method. By combining filters you can get very specialized information, e.g. all instances of a specific type that are directly referenced by a root and allocated by methods in a specific assembly.
6.Peak snapshot collection:
--Peak snapshots can be used to get details information about the peak memory usage of the application. The peak snapshot includes information such as the total number of instances and bytes before the garbage collection, the number of instances and bytes collected, and the number of instances and bytes that are unreachable but still exist on the GC heap.
7.Dependency Propery Evaluation:
--When profiling a WPF or Silverlight application, the profiler will evaluate DependencyProperties. The properties will be presented as "pseudo-fields" in views like "Referenced by," "References", "Field values", and "Instance graph" under the Type instance details page.
8.Instance Graph:
--The new instance graph gives you a visual overview of how a managed instance is being used, how it is related to other instances, and, maybe most importantly, how roots are preventing it from being garbage collected.
9.Profile Multiple Runtimes:
--If multiple versions of the .NET runtime are loaded into the profiled process, a runtime selector becomes available in the main window. Using this selector you can select for which runtime the information should be presented, or whether information should be presented for all runtimes.
Updates:Standard Profiling, Production Code Profiling, Automatic Memory Analyzer, Types, Resources, and Filters Overview, Type, Resource, and Filter Details, Instance Details, Focus on a Single Runtime or AppDomain , Real-time Data Collection, Support for .NET Framework 2.0, 3.0, 3.5, and 4.0
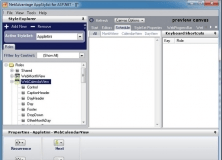
It helps you build full-featured business applications for any web browser.
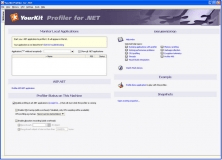
YourKit Profiler provides zero-overhead profiling for your .NET applications.