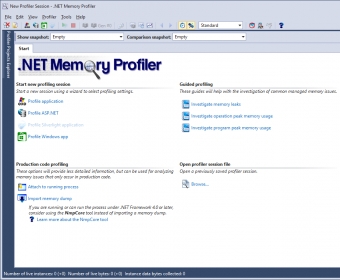
.NET Memory Profiler is a powerful tool for finding memory leaks and optimizing the memory usage in programs written in C#, VB.NET or any other .NET Language. With the help of the profiling guides, the automatic memory analyzer, and specialized trackers, you can make sure that your program has no memory or resource leaks, and that the memory usage is as optimal as possible.
Excessive memory and resource usage, excessive allocations, and bad allocation patterns, will negatively affect the performance of your program. .NET Memory Profiler will provide you with the information you need to optimize memory and resource usage.

Powerful debugger, drag-and-drop components, excellent tutorial support....
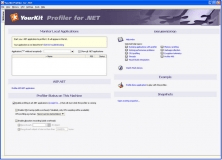
YourKit Profiler provides zero-overhead profiling for your .NET applications.


Comments